On the Degrees of Freedom
Intution for Degrees of Freedom
In biostatistics, the concept of the degrees of freedom (df) comes up often and is frequently misunderstood, or at least only partially understood. As a student, you may resort to memorization on a case-by-case basis when df comes up in biology classes. Well, so did I. Notably, the equation is df = N-1, when N is the number of classes of data.
To wrap your head around the idea of df, let’s imagine that you’re a coach for a soccer team.
You have 11 players to fit 11 positions on the field. You may assign any player to any position you want, but once you’ve assigned 10 out of 11 players, you no longer have the choice to assign the last player as you desire. The player would have to play whichever the last position that’s left open. So, the number of degrees of freedom that you have is 11 - 1 = 10. However, picking the right N can be tricky.
Say, you’re interested in investigating the sources of daily caffeine—coffee, tea, soda, and energy drinks—for average Americans.

However, your research collaborator gave your the data, they were tabulated with brand choices for soda as well. Knowing whether the soda brand choice was a Coca-Cola or Dr. Pepper isn’t more or less helpful for the question you’re investigating, which only concerns the types of the drinks. So, the relevant level of freedom for this particular question for this particular set of data is within the constraint of caffeine sources, and not brands. So, you may use the number of degrees of freedom to be 4 - 1 = 3.
The key takeaway is that the degrees of freedom depend on both the data AND the question that’s being asked. Same data but different question may have different degrees of freedom in your analysis.
Lenticular Coin Flips: a Chi-Square Case-Study
On your last birthday, your parent surprised you with an amazing present, a collectible lenticular coin you’d been asking for. It is special, because depending on the angle you’re looking at the coin, the engraving may appear as a dragon or a monkey.


Now, your friend had asked you to referee a soccer game, you need to coin flip to decide who gets the kickoff. Naturally, you’d like to use your newly minted dragon-monkey coin, but you aren’t sure if the coin was even fair.
You set out to investigate if your gifted coin has the same chances of the coin landing heads as tails by tossing the coin 1000 times and conducting a Chi-square test. You write down all your observations. The coin still has heads and tails like any other coin; however, because the orientation in which the coin lands is random, when it lands a heads, about 50% of the times you’d see a head of a dragon. The other 50% of the times, you’d see a head of a monkey. The heads and tails results are independently of whether you’re looking at a dragon or a monkey.
| coin toss results | count |
|---|---|
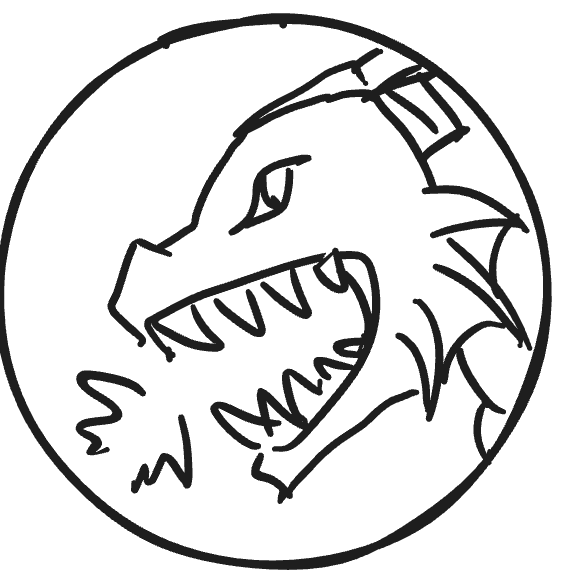 dragon heads dragon heads | 119 |
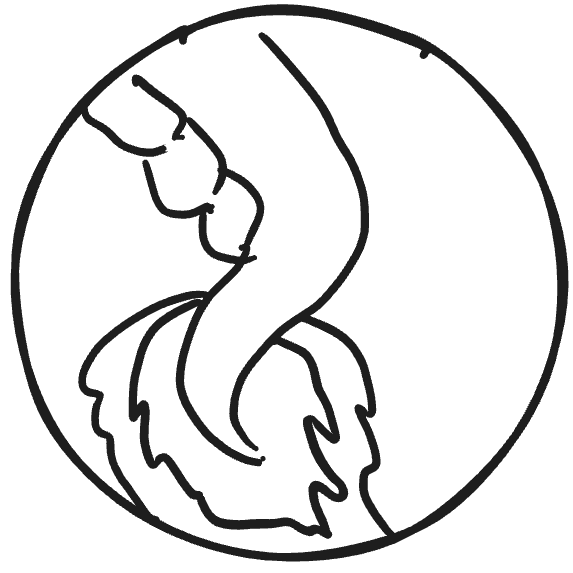 dragon tails dragon tails | 370 |
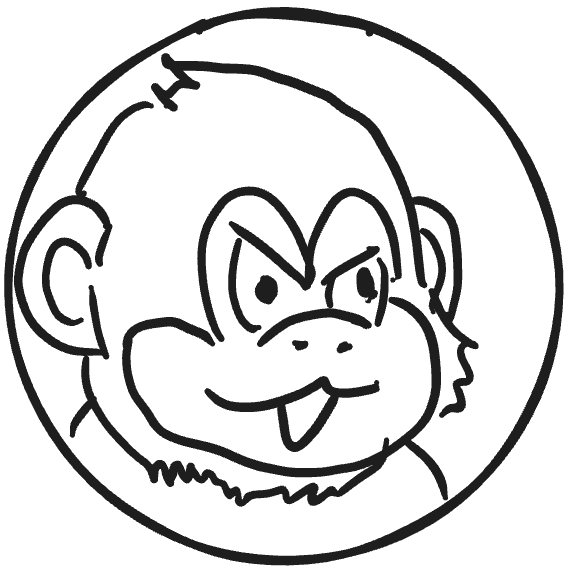 monkey heads monkey heads | 135 |
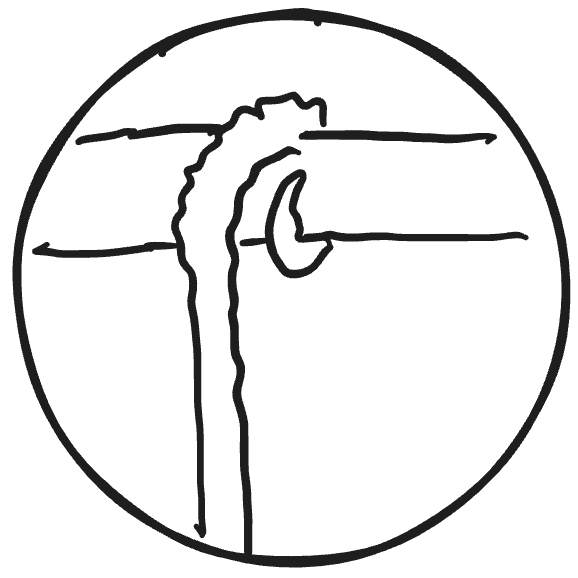 monkey tails monkey tails | 376 |
You finally have all the information you need to conduct a Chi-square test of your own. However, you remember that you’re only testing to see if this coin is fair, which has nothing to do with whether you’re observing a dragon or a monkey engraving. Therefore, whether you see a dragon or a monkey head engraving, you can lump both of them together as the times that the coin lands heads. Same for tails.
| coin flip results | counts |
|---|---|
| combined heads | 119 + 135 = 254 |
| combined tails | 370 + 376 = 746 |
| total | 254 + 746 = 1000 |
It’s probably quite obvious now that the coin is NOT fair, but you calculate the Chi-square test nonetheless.
| classes | observed | expected | $(O-E)$ | $(O-E)^2$ | $\frac{(O-E)^2}{E}$ |
|---|---|---|---|---|---|
| heads | 254 | 500 | 254 - 500 = -246 | 60516 | 121.03 |
| tails | 746 | 500 | 746 - 500 = 246 | 60516 | 121.03 |
Therefore, our Chi-square value is 242.06! And what should the degrees of freedom be? Since there are only two classes, heads or tails, the degrees of freedom is 2 - 1 = 1! At p = 0.05, the Chi-square threshold is 3.841.
Our calculated Chi-square value for this coin is WAY HIGHER than the threshold. So we can reject our null hypothesis that this coin is fair!! It looks like you’re going to have to bring another coin to your friend’s soccer game.
Can you spot the connection between this example and testing for independent assortment using a test cross?
Testcross Application
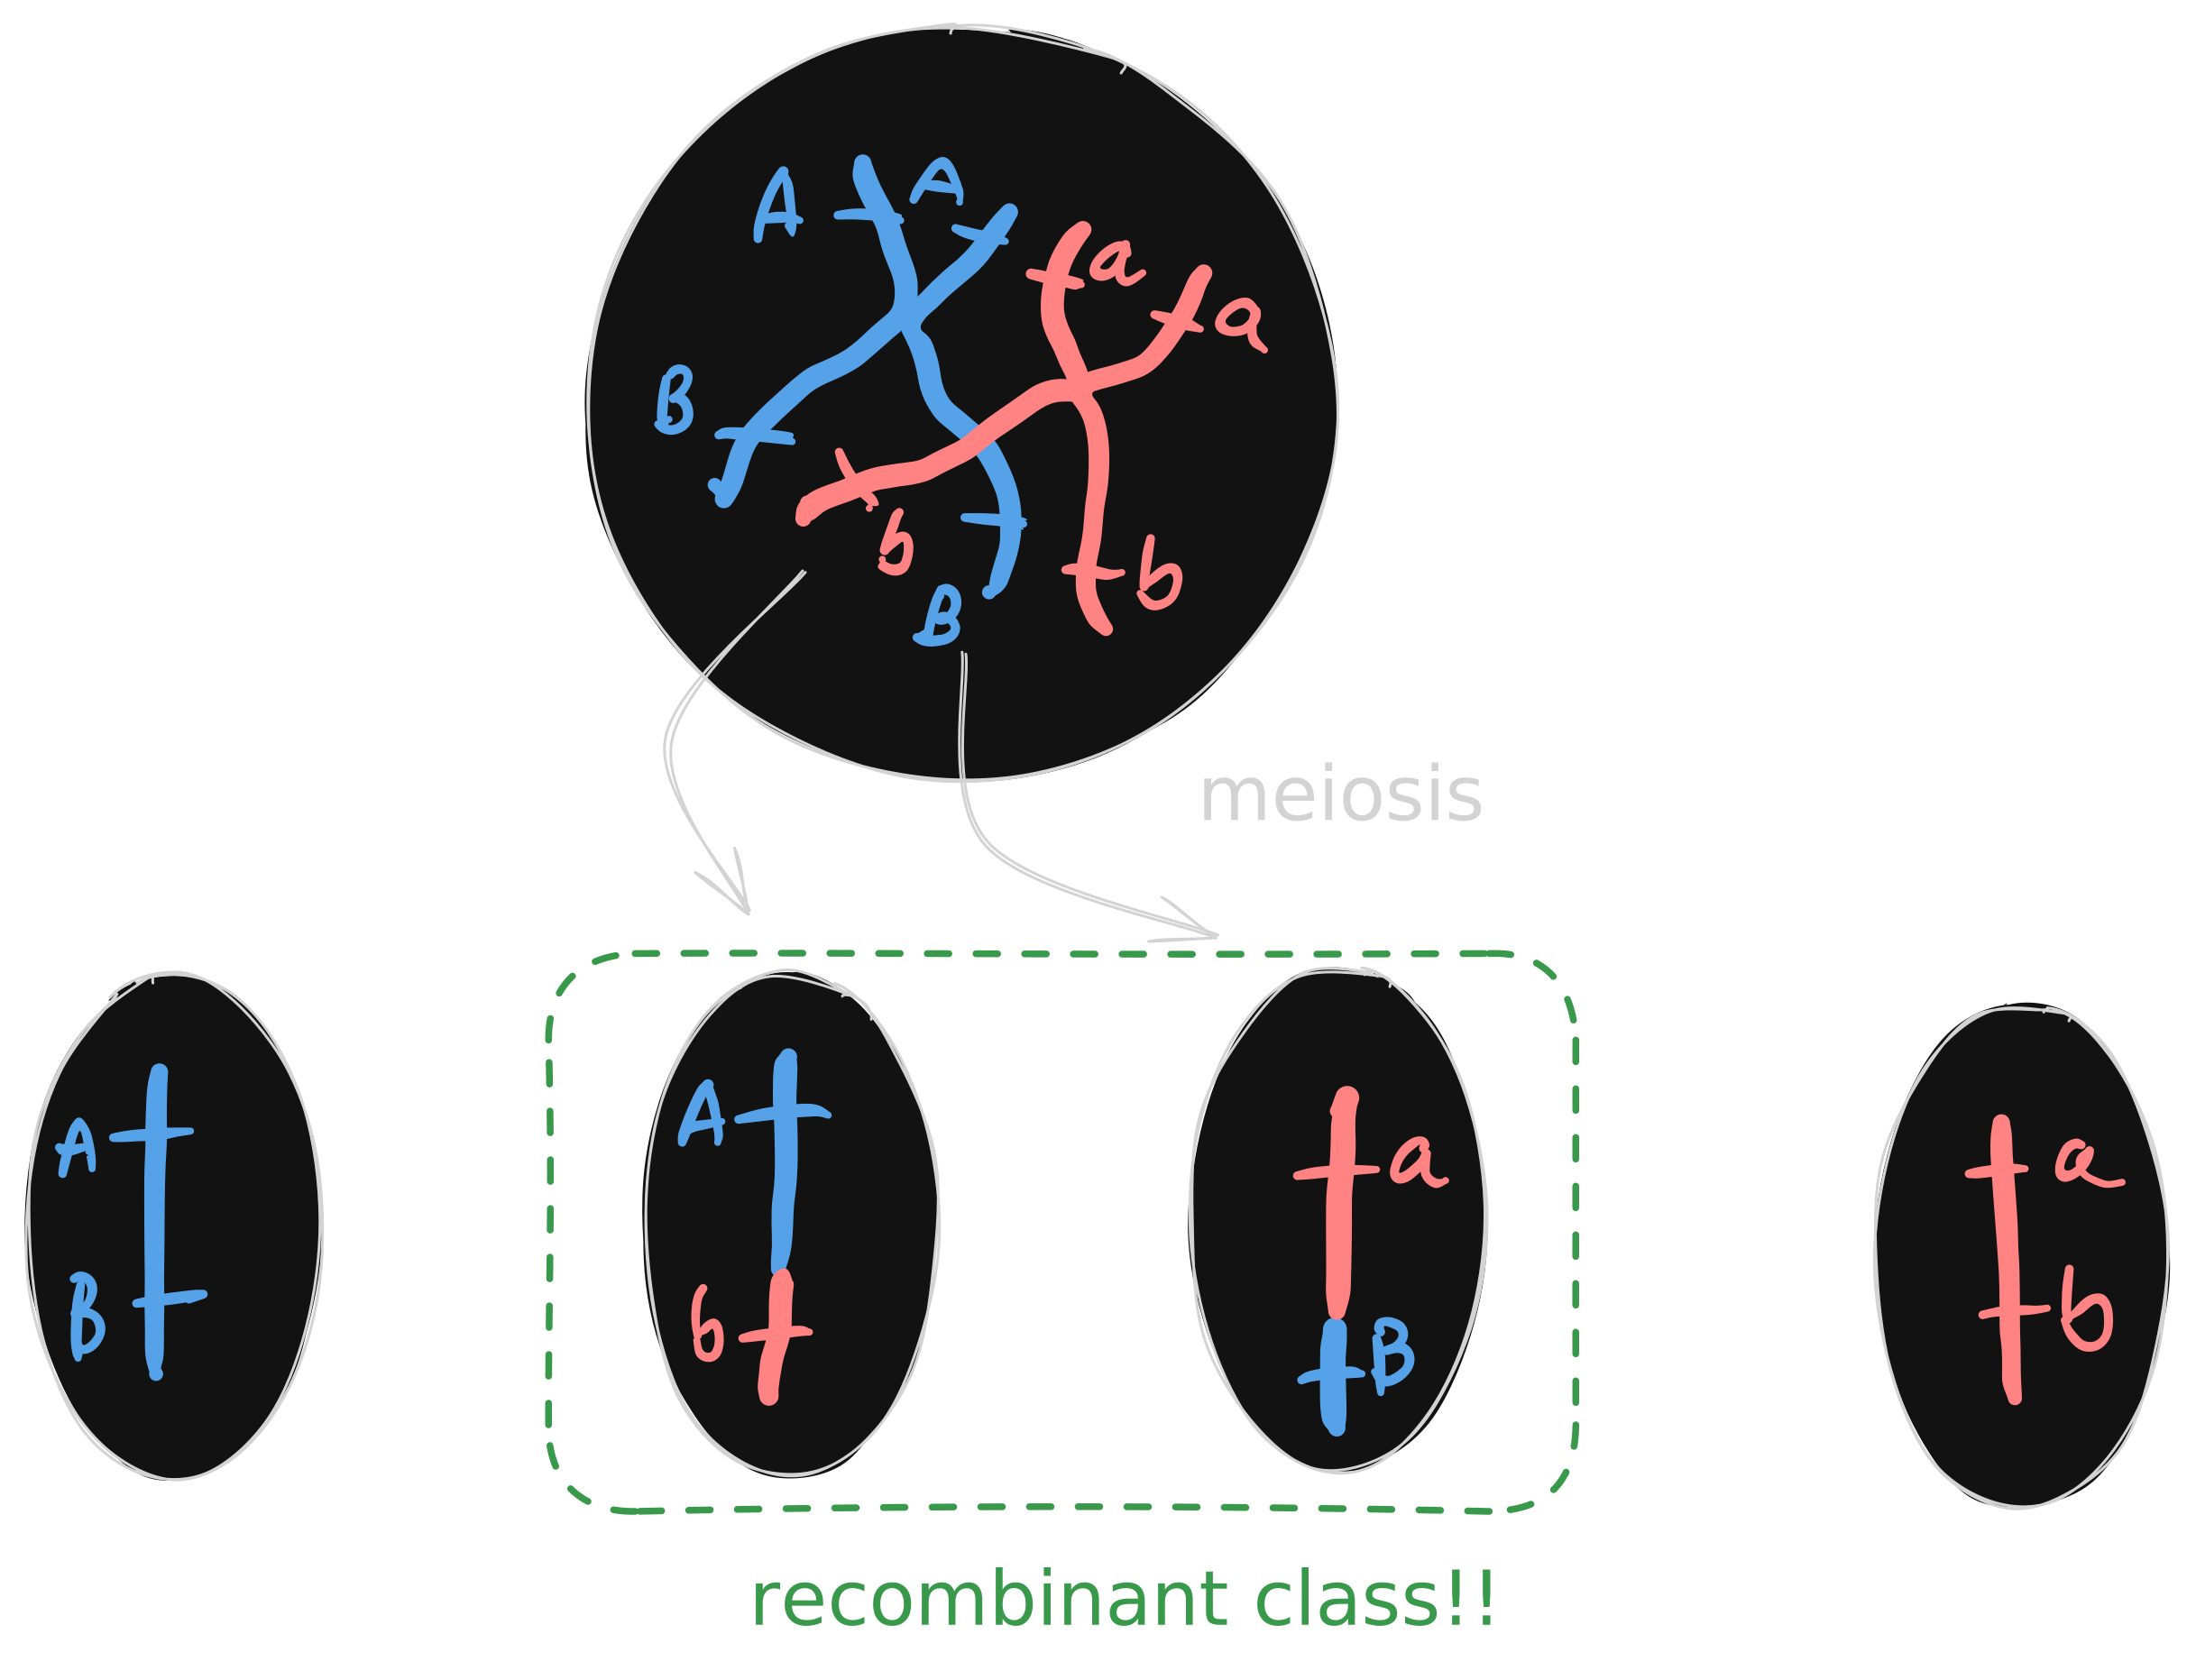
In a sexually-reproducing, diploid organism, let’s set up a testcross for 1000 offspring (see diagram below) and to test for independent assortment—meaning the chances that a meiotic gamete receives parental vs recombinant pairs of A and B allele are equal.
You observe 4 different phenotypes based on the 4 haplotypes shown above. However, similarly to how your lenticular coin can show a dragon or a monkey, when a crossing over occurs between the A and B loci during meiosis, you may observe 1 of the 2 possible recombinant haplotypes with equal probability. In this example, the recombinant haplotypes would be the AB or ab gametes. Recognizing this pattern, you combine those two categories into one recombinant class. The rest goes into the parental class.
What’s the degrees of freedom? Since there are 2 classes: df = 2 - 1 = 1.
Bonus questions:
- Can you calculate the Chi-square value for the testcross results above? What’s the null hypothesis? Do you reject the null?
- How would you test if the probability of seeing the
dragonengraving is actually the same as amonkey(50:50)?